
Spinorama plots with CLIO and CLIO Pocket
by admin • 23 May 2023 • Application Briefs, News
We have published an application note in which we introduce a Scilab script for creating directivity ‘Spinorama’ plots that are compliant with ANSI/CEA 2034A standards. The data used for these plots are measured using CLIO and CLIO Pocket systems.
Creating Spinorama Plots from Polar Measurements Sets
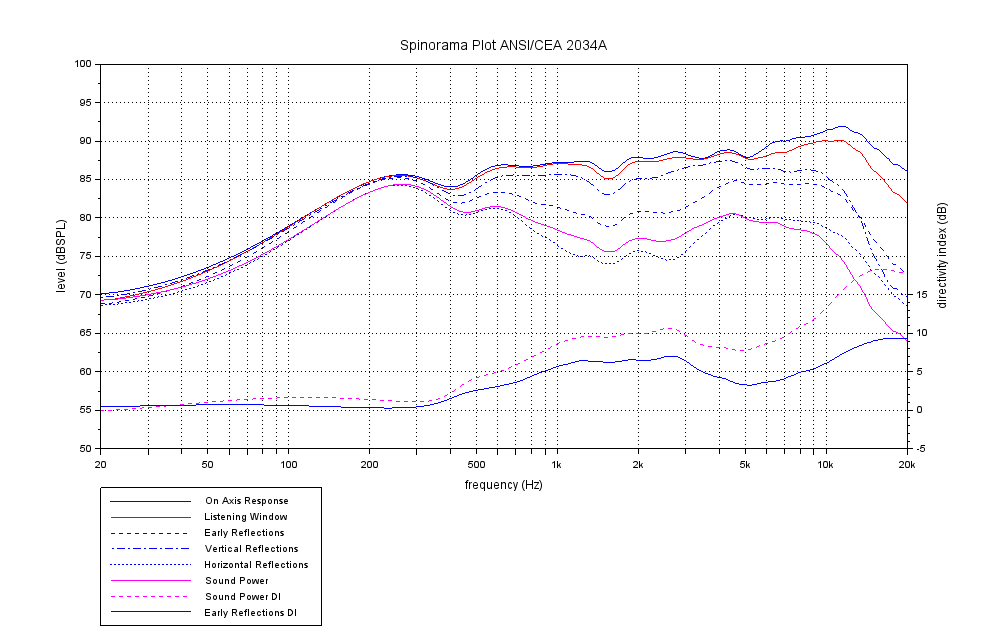
A spinorama plot is a graphical representation of loudspeaker/room interaction developed by Dr. Floyd Toole. It allows us to visualize the sound dispersion characteristics of a loudspeaker, depicting how it radiates energy in different directions and frequencies. The plot typically consists of curves representing parameters such as on-axis response, off-axis response, total radiated sound power, and sound pressure level at various angles and frequencies. These parameters are crucial in capturing the most significant room reflections within a typical listening environment. By examining these plots, it becomes possible to assess the loudspeaker’s frequency response, directivity, and overall sonic performance. Spinorama plots are valuable tools for comparing different loudspeaker models, evaluating performance in various rooms, and identifying any irregularities or limitations that may affect sound quality.